The Analytics section provides comprehensive insights into your AI agents’ performance, usage patterns, and operational efficiency, helping you make data-driven decisions about optimization and development.
Analytics Overview
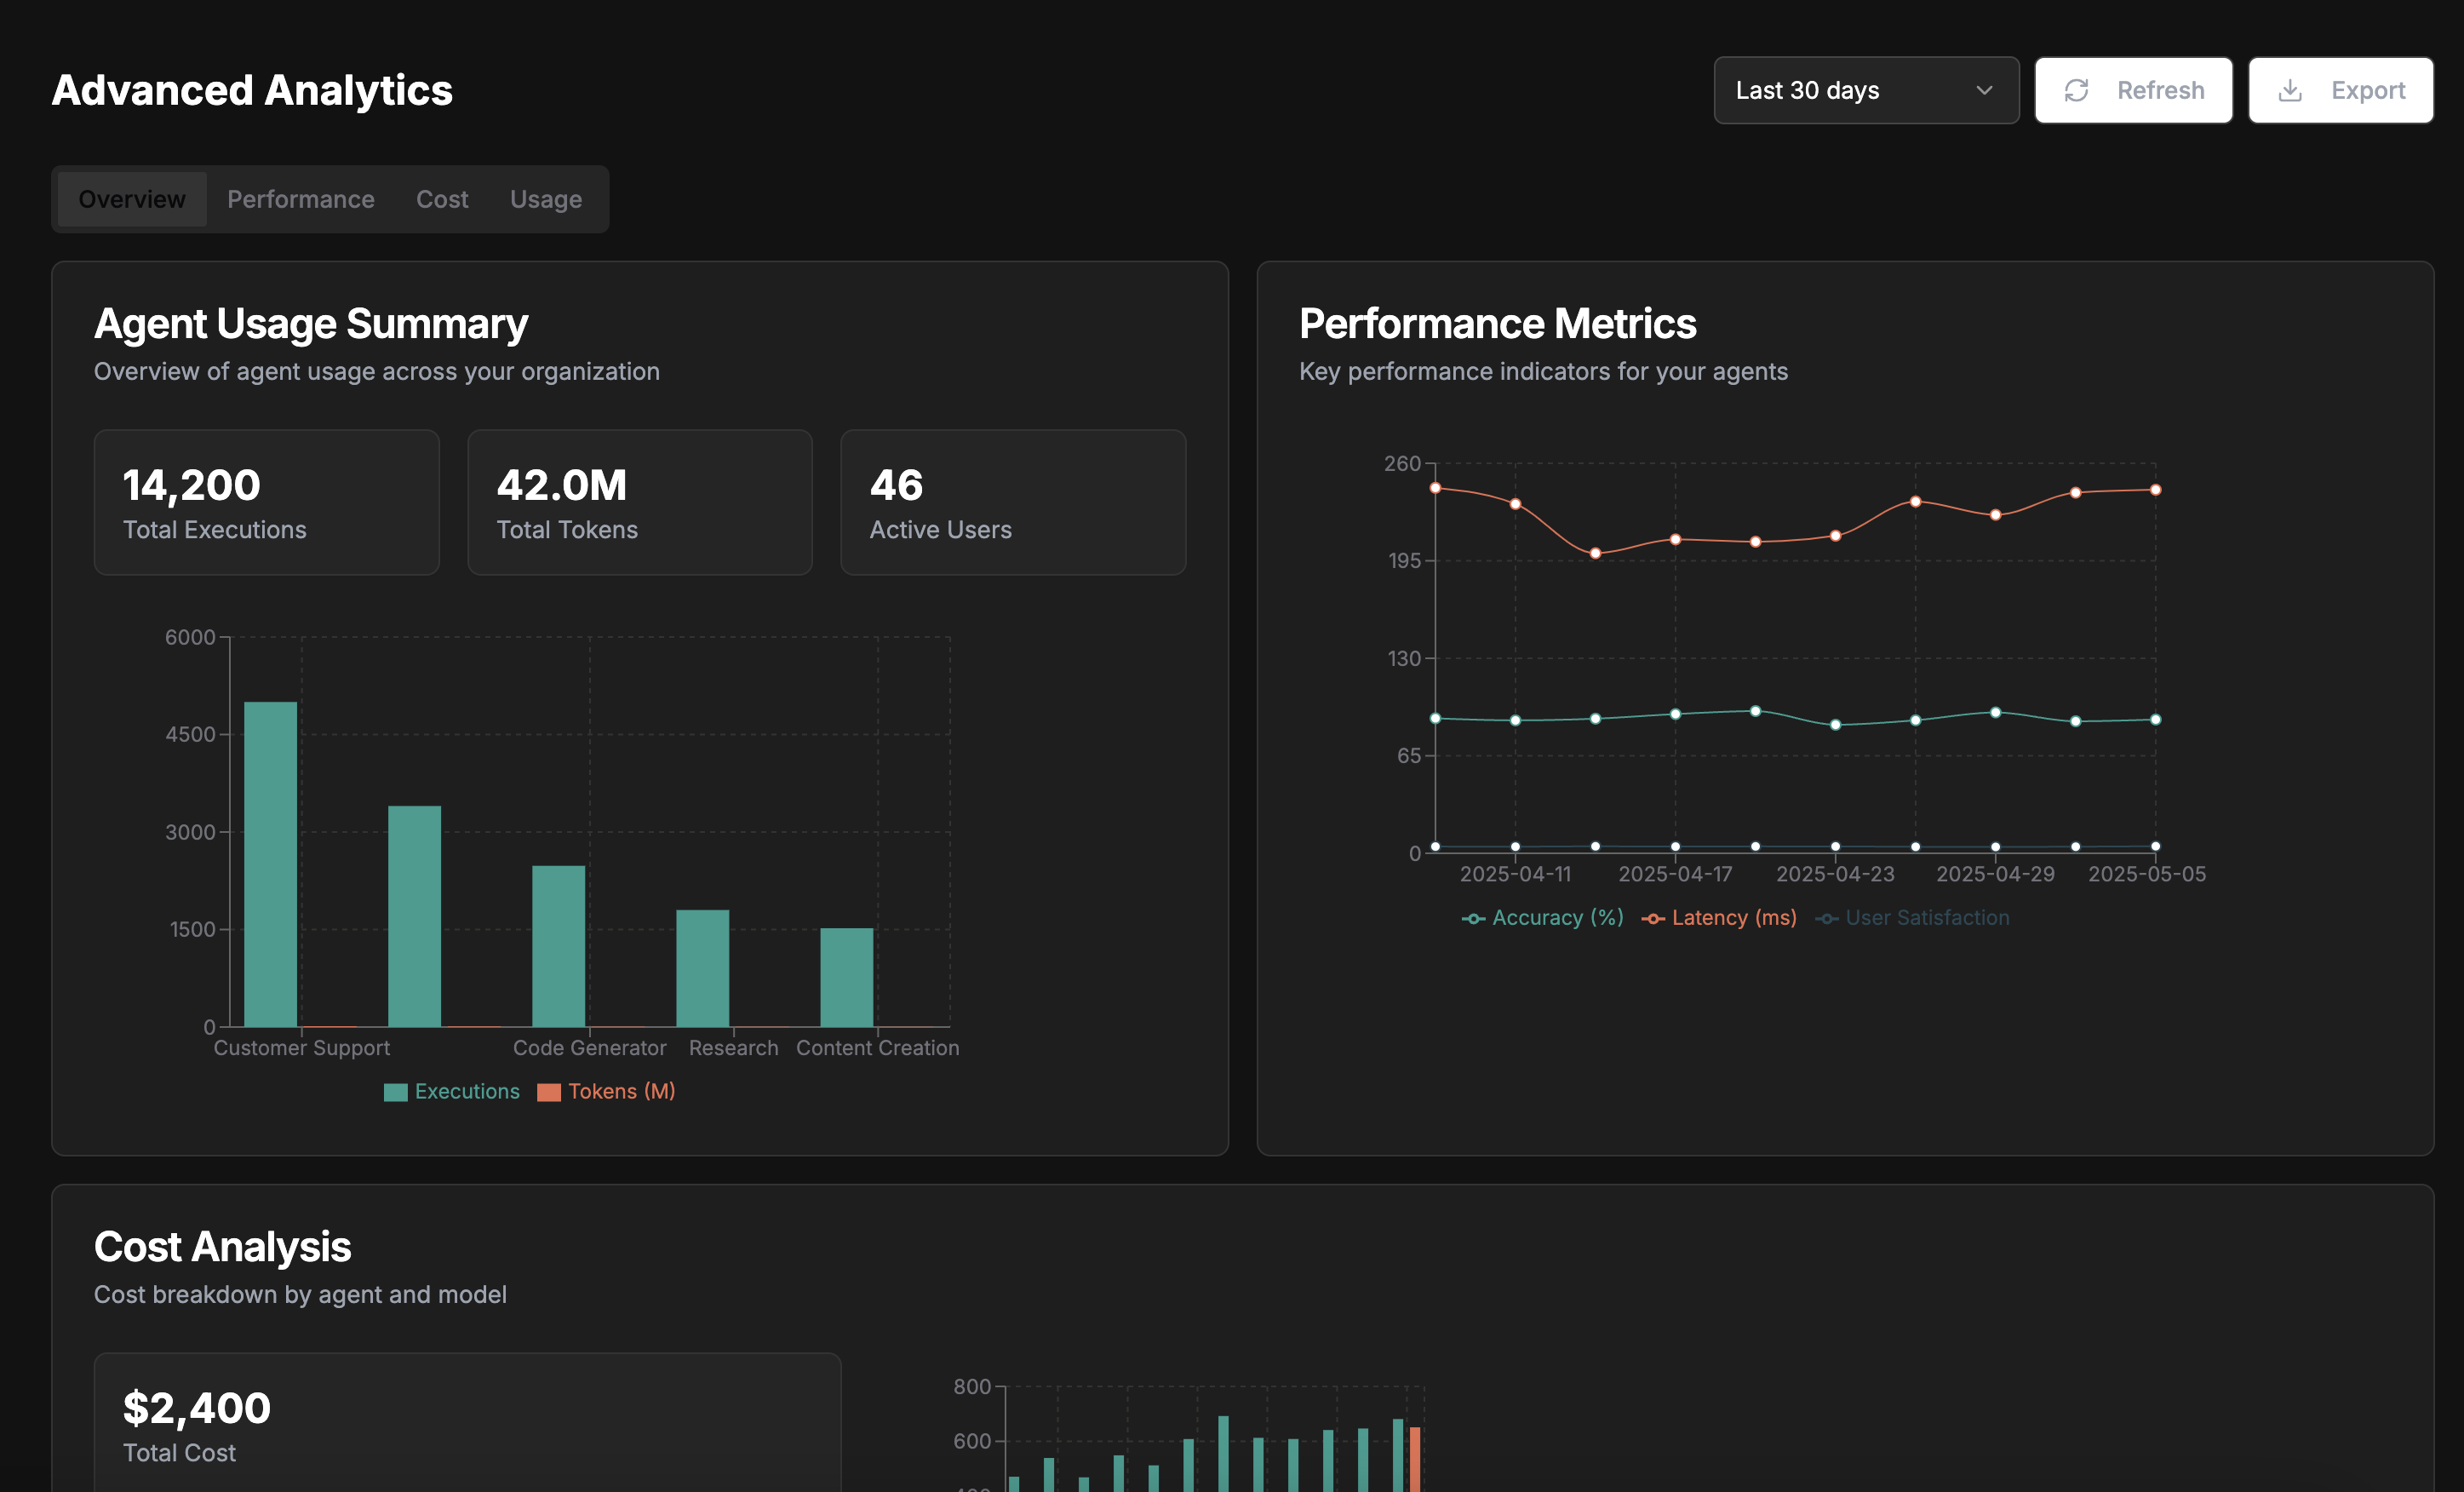
Analytics in Xenovia goes beyond basic metrics to provide actionable insights that drive continuous improvement.
Usage Metrics
Track how your agents are being used
Performance Comparison
Compare different agents or versions
Cost Analysis
Monitor and optimize your spending
Usage Trends
Identify patterns and forecast future needs
Usage Metrics
The Usage Metrics section tracks how your agents are being used:- Request Volume
- User Engagement
- Geographic Distribution
- Feature Utilization
- Total requests over time
- Requests by agent or category
- Peak usage periods
- Request distribution by time
Use date range selectors to analyze usage patterns over different time periods, from hours to months.
Performance Comparison
The Performance Comparison section allows you to compare different agents or versions:Response Time
Compare processing speed and efficiency
Success Rates
Analyze task completion and error rates
User Satisfaction
Compare feedback and satisfaction scores
Cost Efficiency
Analyze value delivered per token or request
- Side-by-side metric visualization
- Percentage difference calculation
- Statistical significance testing
- Historical trend comparison
- Benchmark comparison
Cost Analysis
The Cost Analysis section helps you monitor and optimize your spending:Set up cost alerts to be notified when spending approaches predefined thresholds.
Usage Trends
The Usage Trends section helps you identify patterns and forecast future needs:- Seasonal Variations
- Growth Trends
- Correlation Analysis
- Predictive Forecasts
- Daily patterns
- Weekly cycles
- Monthly trends
- Seasonal fluctuations
Custom Reports
Xenovia allows you to create custom reports tailored to your specific needs:Data Export
Analytics data can be exported in various formats:- CSV/Excel: For detailed data analysis
- PDF Reports: For sharing and presentation
- API Access: For integration with other systems
- Dashboard Links: For sharing interactive views
Exported data respects user permissions and data access controls.
Related Components
Dashboard
High-level overview
Testing
Performance validation
Fine-tuning
Model optimization