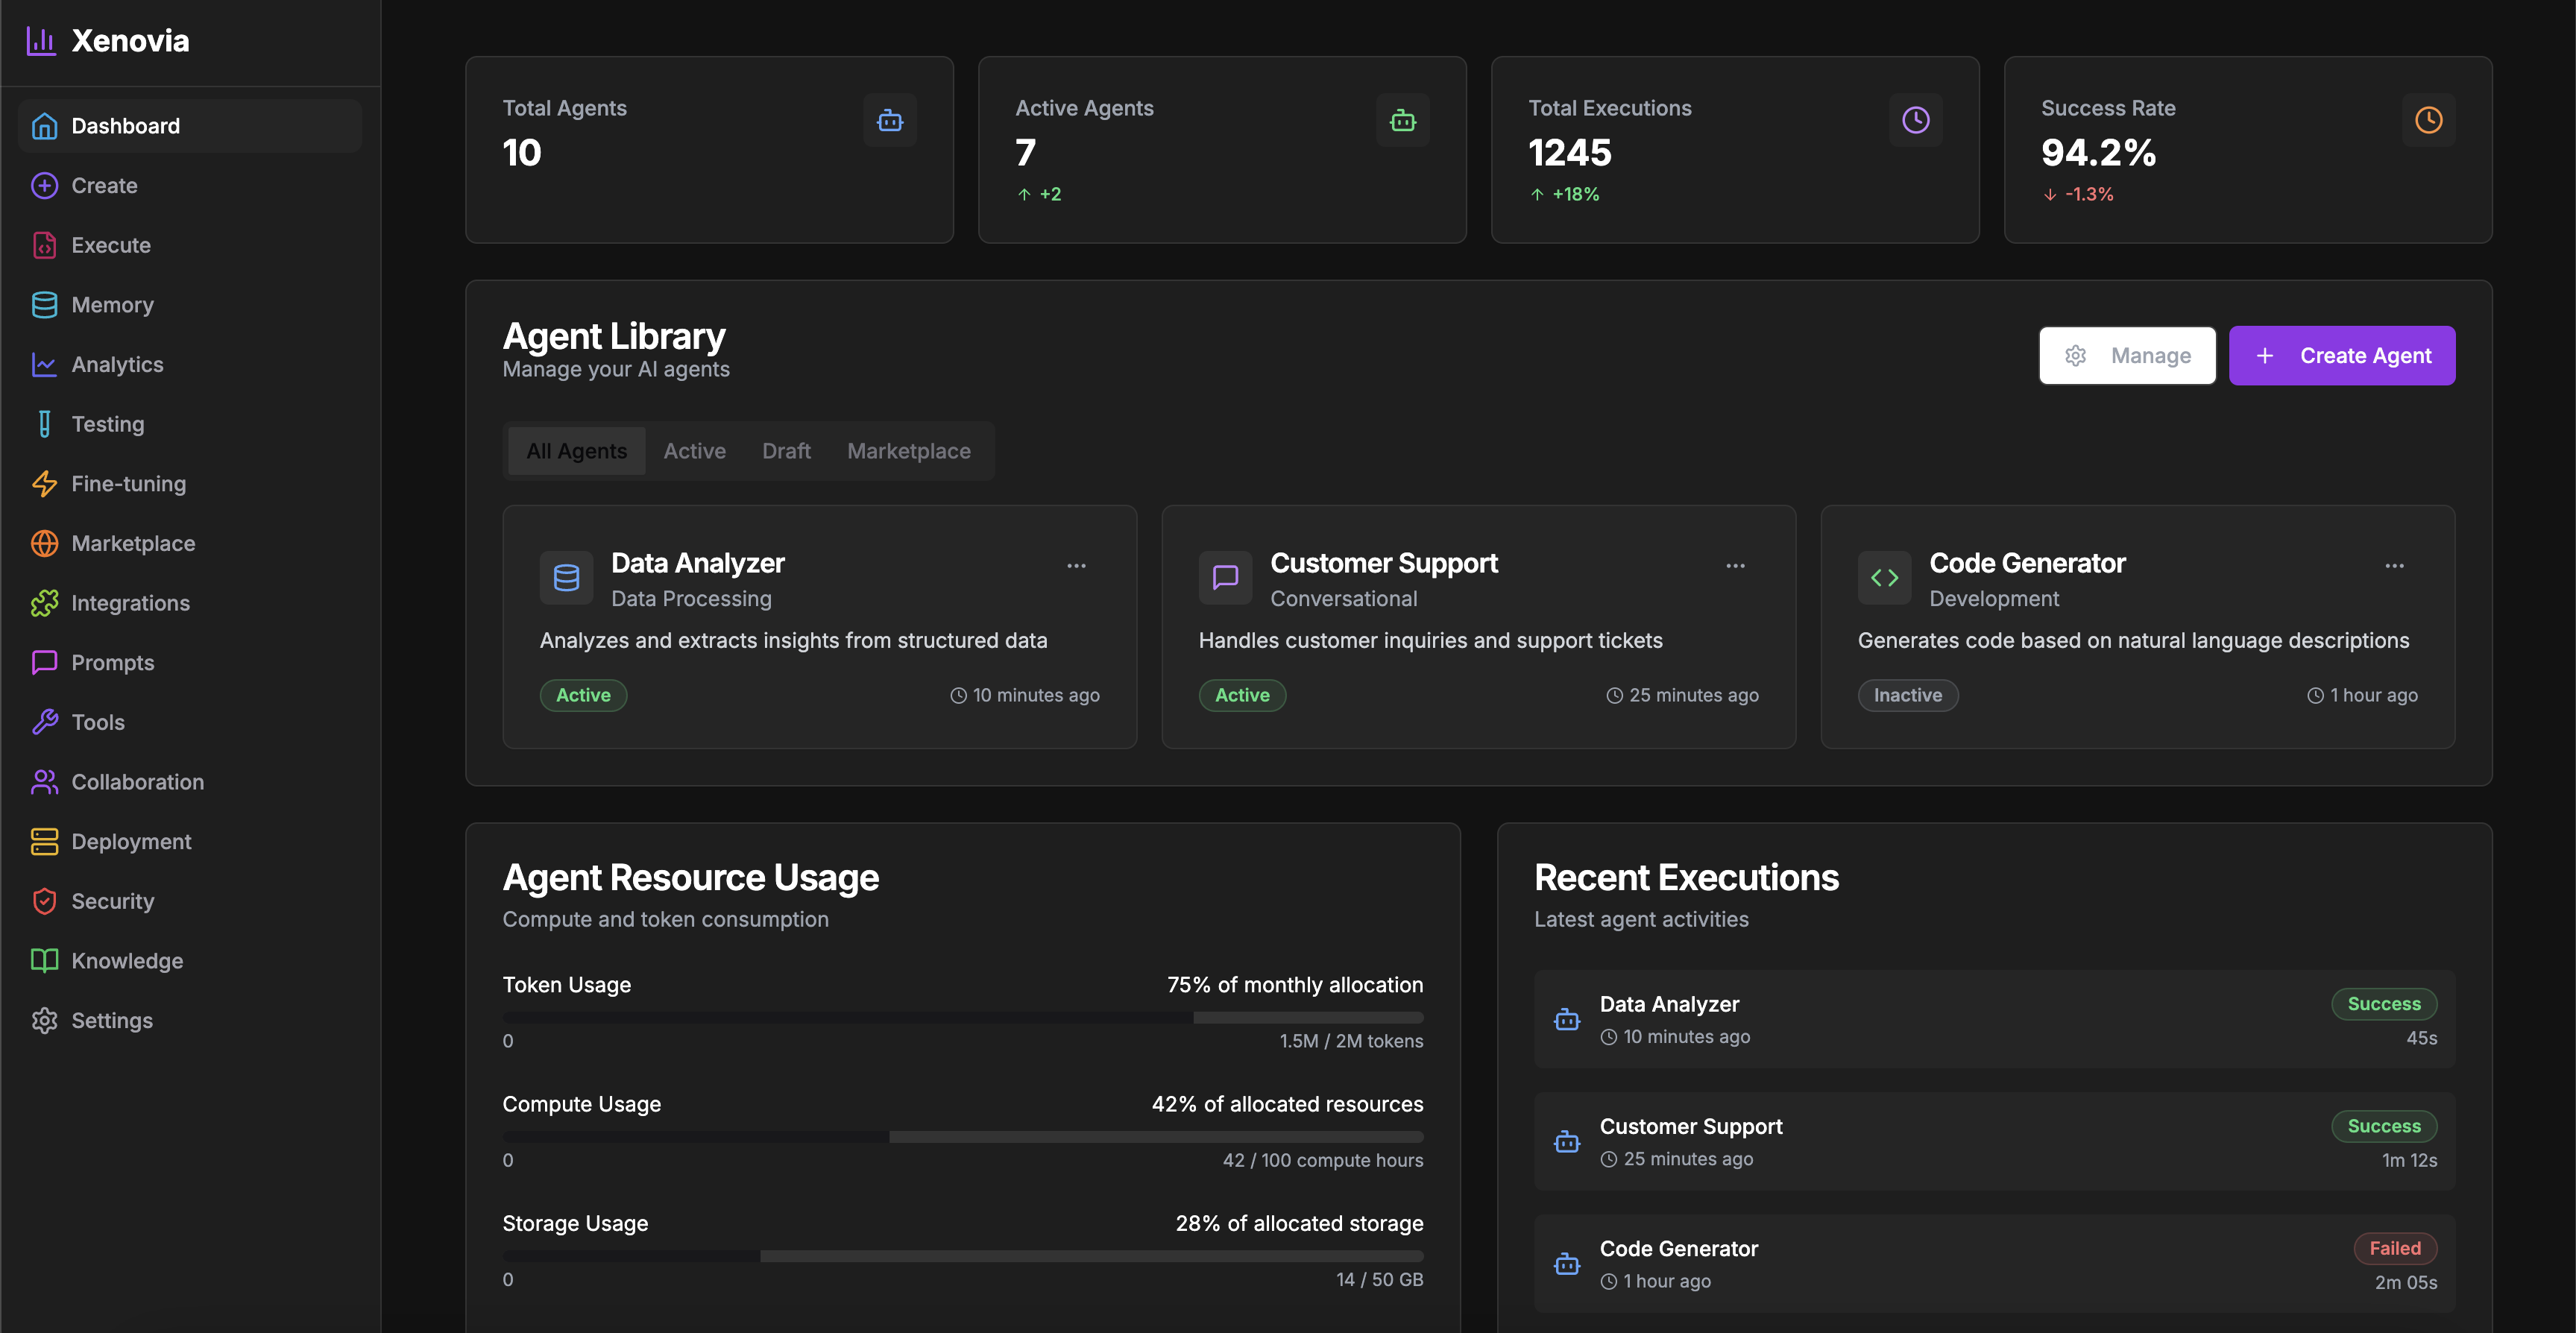
The Dashboard is the central hub of the Xenovia platform, providing a comprehensive overview of your AI agents, their performance, and system resources. It serves as the starting point for navigating to other sections of the platform.
Key Features
Agent Library
Access all your AI agents in one place
Performance Metrics
Track key performance indicators
Resource Usage
Monitor system resource consumption
Recent Executions
View recent agent activities
Agent Library
The Agent Library provides a collection of all your AI agents with quick access to their details, status, and actions.Use the search and filter options to quickly find specific agents in large deployments.
- View agent details and configuration
- Check operational status
- Access edit and configuration options
- Execute agents directly
- View performance statistics
Performance Metrics
The Dashboard presents visual representations of important metrics to help you understand your AI operations at a glance:- Agent Metrics
- Execution Metrics
- Usage Metrics
- Total number of agents
- Active vs. inactive agents
- Agent creation trends
- Agent types distribution
Resource Usage
The Resource Usage section monitors system resource consumption to help you optimize performance and manage costs:- CPU Utilization: Track processing power usage
- Memory Usage: Monitor RAM consumption
- API Call Volume: Track external service usage
- Token Consumption: Monitor model token usage
- Storage Utilization: Track data storage usage
Set up alerts for resource thresholds to avoid unexpected costs or performance issues.
Recent Executions
The Recent Executions section provides a chronological list of agent activities, showing:- Execution ID and timestamp
- Agent name and version
- Execution status (success, error, in progress)
- Duration and resource consumption
- User or system that initiated the execution
- Quick access to detailed logs
Dashboard Customization
Xenovia allows you to customize the Dashboard to focus on the metrics and information most relevant to your needs:Related Components
Analytics
Detailed performance insights
Agent Execution
Run and test your agents
Agent Creation
Build new AI agents